Logic Analyzer for Embedded Interfaces DataSheet

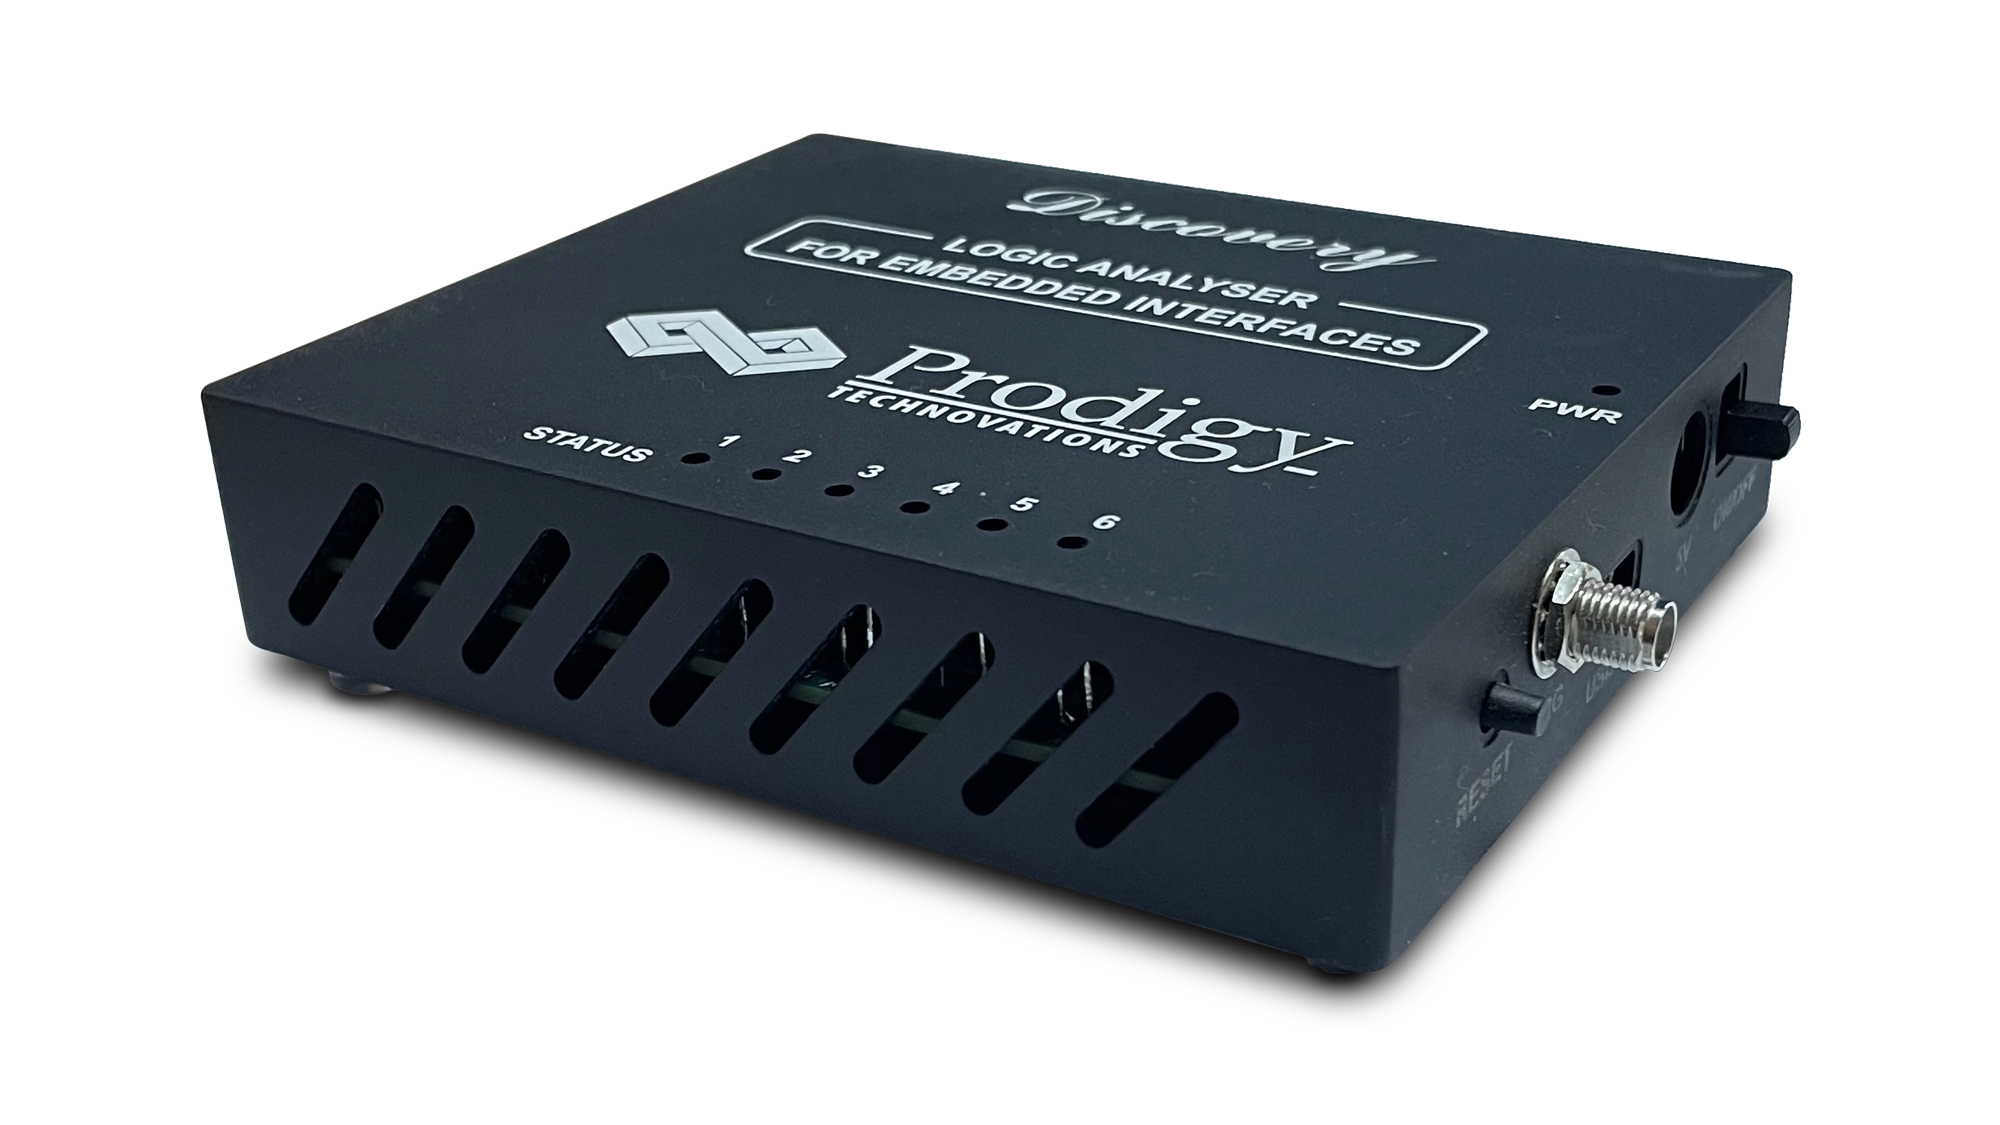
The Discovery logic analyzer series, PGY-LA-EMBD has the built-in capability to debug I2C protocol, SPI protocol, UART, and many other serial protocols. This is a PC-based logic analyzer designed for professional engineers. The Discovery logic analyzer is used to debug embedded systems, the logic analyzer not only reduces the workbench area but also allows it to have a very small form factor and can be used to debug failures in the field. The protocol decode capabilities are designed to debug the logic and protocol issues faced by embedded design teams in the consumer, industrial, home automation, health, and education sectors.

PGY-LA-EMBD is an industry-first logic analyzer in its category which enables engineers to debug timing problems and perform simultaneous protocol analysis of I2C, SPI, UART or I3C, SPMI, and RFFE and also has support for CAN, CAN FD in embedded designs. This enables designers to debug circuit-level and system-level problems quickly.
PGY-LA-EMBD offers 1GS/Sec asynchronous (timing) data and 100Mhz synchronous (state) data capture which makes it an ideal debug tool to address digital design problems. Designers can now easily analyze setup and hold time issues, glitches, and synchronous data activities apart from analyzing protocol issues.
Current generation embedded designers need to collect data from multiple interfaces such as I2C, SPI, UART, I3C, SPMI, RFFE, CAN and , CAN FD and process it to achieve optimal performance of their design. Embedded design teams needs to take timely action to meet the intended objectives of the product. PGY-LA-EMBD decodes I2C, SPI, UART or I3C, SPMI, RFFE and CAN, CAN FD bus and displays the protocol activity with time stamp information. PGY-LA-EMBD is an ideal instrument to debug hardware and embedded software integration issues and optimize the software performance.
Multiple markers enable smart delta measurements which are key to designers. Zoom enables users to look at specific areas of the signal.
Features:
- 16 channels with Protocol and Logic Analysis capability.
- 1GS/Sec Timing (Asynchronous) Analysis.
- 100MHz State (Synchronous) Analysis.
- Simultaneous Protocol Analysis of I2C-SPI-UART and I3C-SPMI-RFFE and CAN, CAN-FD.
- Detailed Trigger capabilities: Auto, Pattern, Protocol aware (I2C, SPI, UART, I3C, SPMI, RFFE, CAN) and Timing (Pulse Width and Delay Trigger).
- Smart streaming of data from Protocol Analyzer to host computer for long duration capture using USB 3.0 interface.
- Innovative easy to use Graphical user interface.
- Error Analysis of Protocol packet.
- Provides Timing, Waveform, Listing and Protocol listing views.
- Detailed filtering capability for protocol decoded data.
- PDF and CSV report format.
- API support.
Product SETUP
Easy to Configure
Users can easily configure the Logic Analyzer for embedded interfaces by either selecting Logic Analysis(LA) mode or Protocol Analysis (PA) mode or a combined (LA+PA) mode. This ensures a quick and easy way to configure the product and look at complex problems at the system level either in Logic Analysis (State Analysis, Timing Analysis), or Protocol decoding, or both. Save and Recall capability ensures designers can recall their custom setup details.
Multiple Domain
Multiple domain Views provide the necessary complete view of all supported interface states, timing and protocol activity. Users can easily setup the analyzer to view timing, logic and decode views to enable easy insights to the design. Users can set different trigger conditions from the setup menu to capture Timing and Protocol activity at specific events. The decoded results can be viewed in Timing, Logic and Protocol listing window with auto correlation. This comprehensive view of information makes it industry’s best, offering an easy to use solution to debug the embedded interfaces protocol activity and analyze timing issues. Multiple cursors help designers to look into details of their design performance.
Timing View
Timing view is a unique capability of the PGY-LA-EMBD which enables designers to get detailed insights into their signals’ timing information. The timing view uses an internal clock signal to plot the waveform. The flexible sampling rate selection enables designers to investigate Glitches that can cause issues in the functioning of their designs. The grouping feature enables designers to group various related signals for better viewing and analysis. Marker and Zoom features make it convenient to analyze any timing errors. The ability to analyze any point in the captured data record ensures easy debugging and analysis over a long capture duration.
State View/Waveform Listing View
State view helps designers to see the actual signal behavior. Using the device clock as a reference, it provides the plot of the clock and data signals with a bus diagram. Grouping of signals ensures designers have the flexibility to view signals together. All signals are time-correlated to help look into setup and hold times, pulse width, missing data, etc. which are very critical for digital designs as designers look to optimize their codes.
Protocol Decode View
The protocol Activity window provides the decoded packet information in each state and all packet details with error info in the packets. This gives system-level insight to the design teams. The individual protocol decodes windows based on selected interfaces ensuring easy viewability for design teams. The selected frame in the Protocol listing window will be autocorrelated in the timing view to view the timing information of the packet. Protocol errors will be highlighted to ensure designers are alerted to the same easily.
Powerful Trigger Capabilities
PGY-LA-EMBD supports Auto, pattern, Protocol awareness, and timing parameter trigger capabilities. Users can trigger any of the Protocol packets. Comprehensive Trigger provides the flexibility to monitor different conditions.
Analytics
Detailed analytics on the various protocol to enable better analysis and provide additional insights to designers.
Report
The report can be generated in PDF or CSV format with details of all the signal information, plots, and custom details like the name of the company, logo, tester name, date, and time to ensure designers can document all details and share the report.
Specifications